Water Quality
Level 8 Guiding Question : How do you measure Water Quality and what does its Tell us about our water?
Some of the indicators are listed below. These are just of few of the indicators we will measure in our lab.
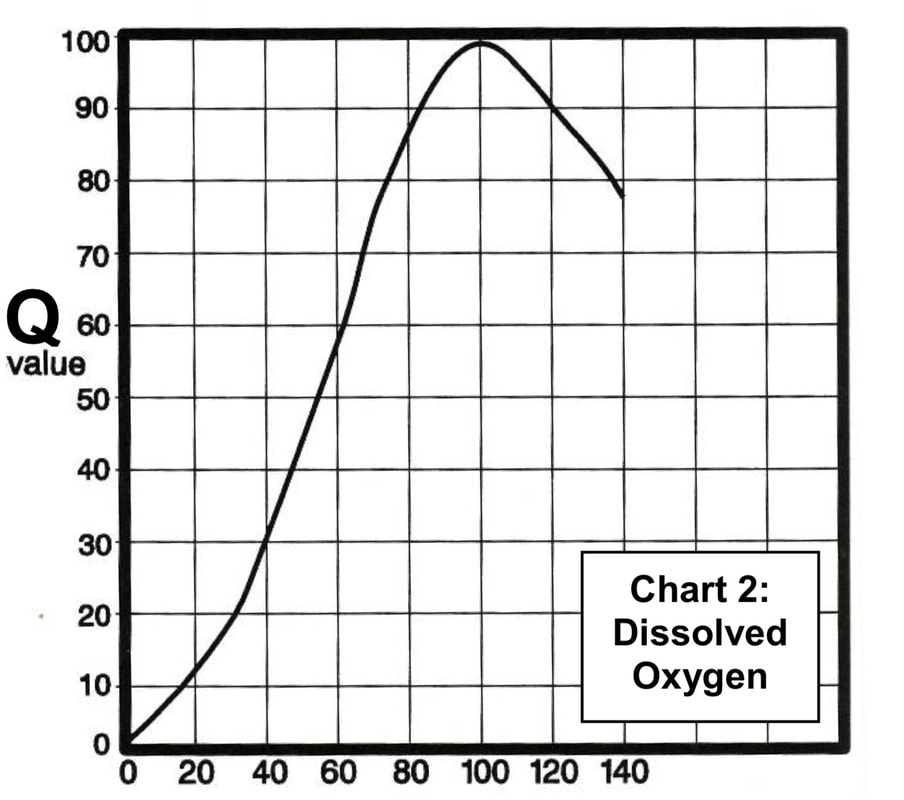
DOThe Dissolved Oxygen test measures the amount of oxygen dissolved in the water.Dissolved oxygen is measured in milligrams per liter (mg/L). Expected levels: 4.0 to 12.0 mg/L
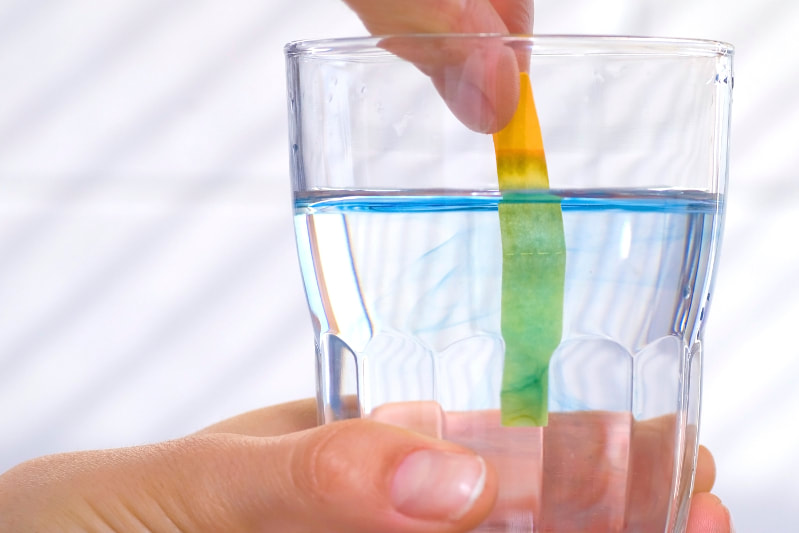
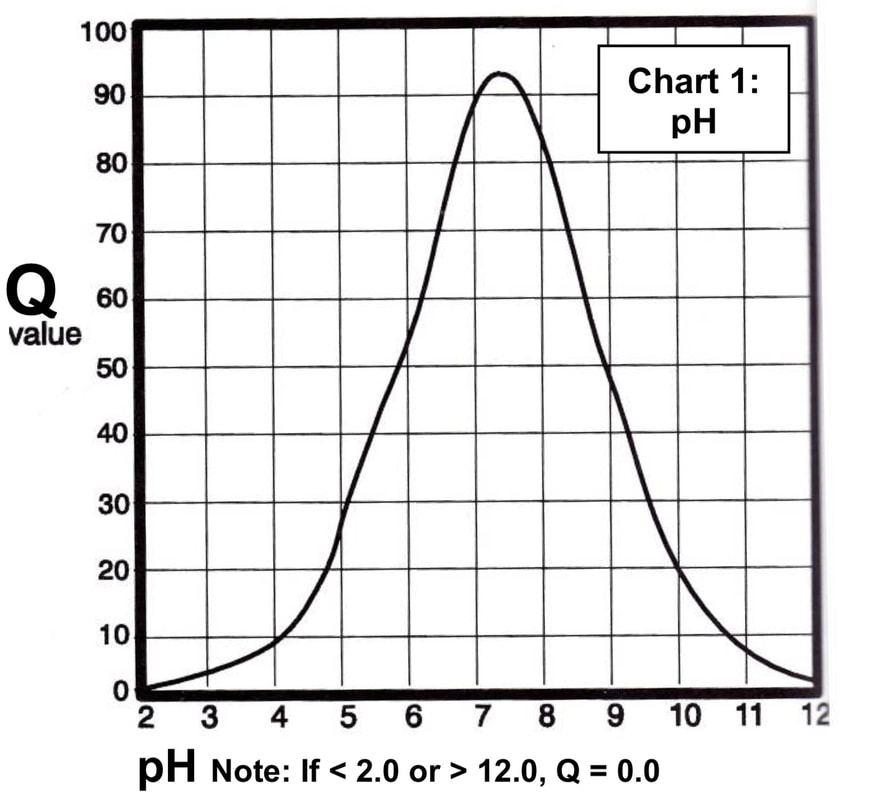
pH pH of 7 is neutral, below 7 is acidic and above 7 is basic or alkaline.While young fish and insect larvae are sensitive to a low pH (acid), extreme values on either end of the scale can be lethal to most organisms. Expected levels: 6.5 to 9.0
|
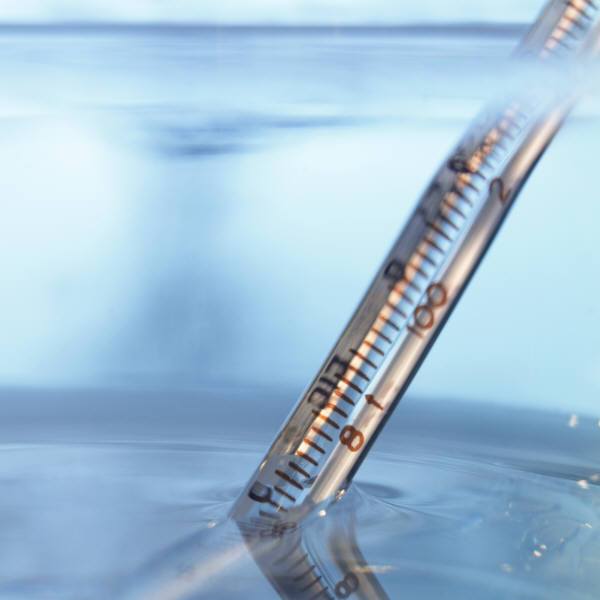
Water temperatureAquatic organisms are dependent on certain Temperature ranges for optimal health. Temperature is measured in degrees Celsius (°C). Seasonal trends: May to October: 22 to 35°C, November to April: 2 to 27°C
Electrical Conductivity (EC)Conductivity in water is affected by inorganic dissolved solids such as salts. Specific conductance is measured in microsiemens per centimeter (µS/cm). Expected levels: 300 to 900 µS/cm
|
Level 8 Investigation: Measuring water quality
Click on the button below to read the following presentation to get familiar information about erosion and weathering and how it affects water run-off and hence water quality.
Lab Instructions & resources
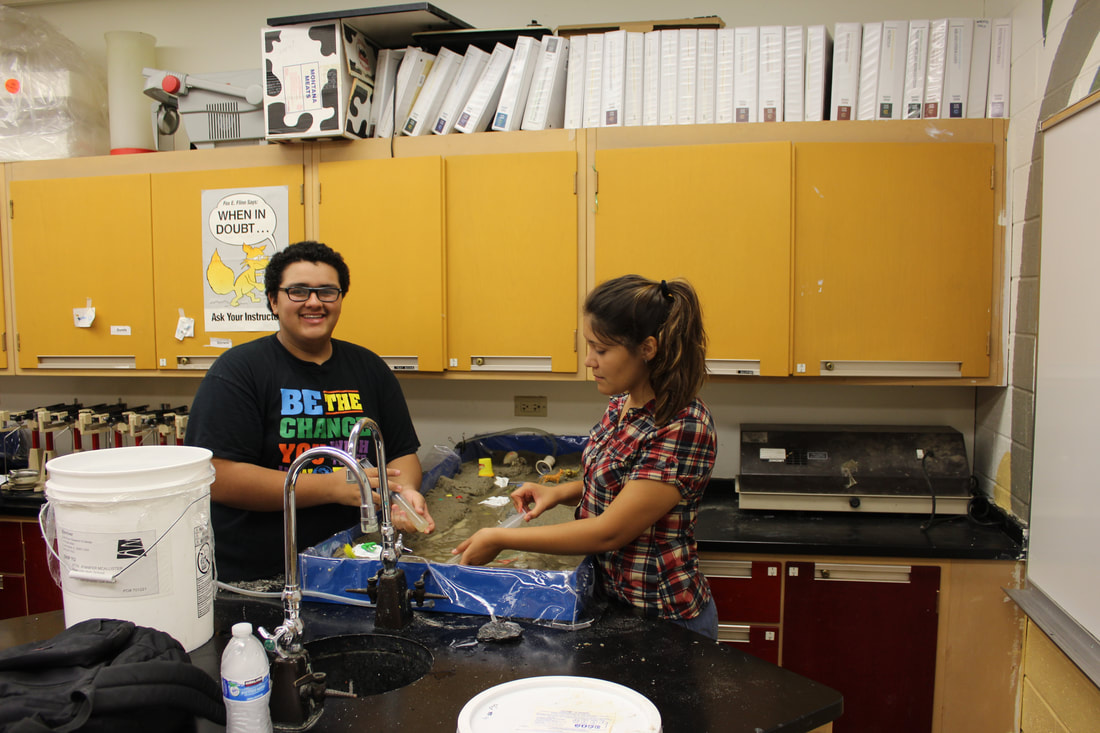
Below are vital resources for the "Determining Water Quality Lab" First read the above information you will need to have it for the data analysis and general information. Next read the lab instructions and materials needed for the lab if you have any questions don't hesitate to ask your instructor or other classmates. Once you understand the procedure assemble all your equipment and supplies don't forget to label all your materials so that if time should run out, and it probably will especially on day 1 you will save set up time on day 2 & 3. It is recommended to use either an iPad or chrome-book for your data logger typically smartphone screens aren't large enough and they handle the data much more efficiently.
After you have completed the lab please upload your data as well as data analysis.
Level 8 Investigation: Water Quality Index
|
|

|
|
|
Print out the Water Quality Index Worksheet to complete the data collection portion of this lab.
| water_quality_index_worksheet_asc3.06d.docx |
|
|
|
procedure for calculating "Water Quality Index"
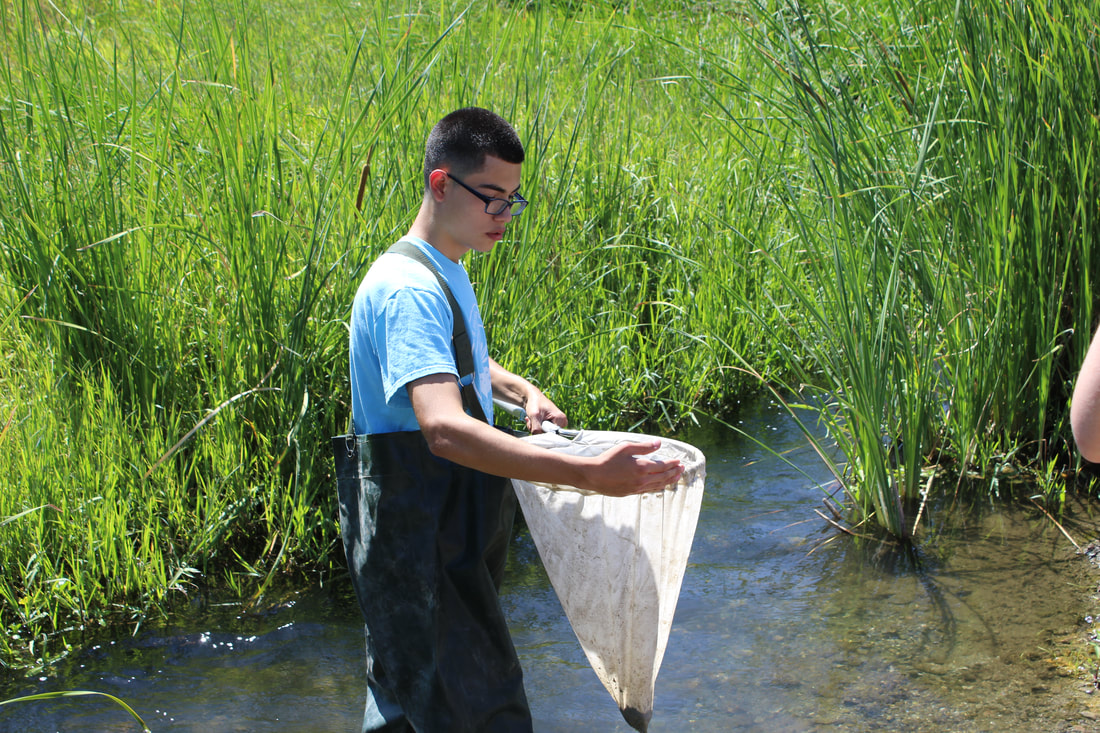
Surface water samples are collected from as many sampling locations you would like to sample such as rivers, streams, creeks or other local water ways. Samples are collected in water or soil vials and analyzed for several water quality parameters (see the chart in the "Water Quality Index worksheet" above. Collect 20 ml of water into the vials and label them with location, date and student name. Using digital probe-ware and chemical test kits record the findings in student notebooks or in the "Water Quality Index worksheet" above.
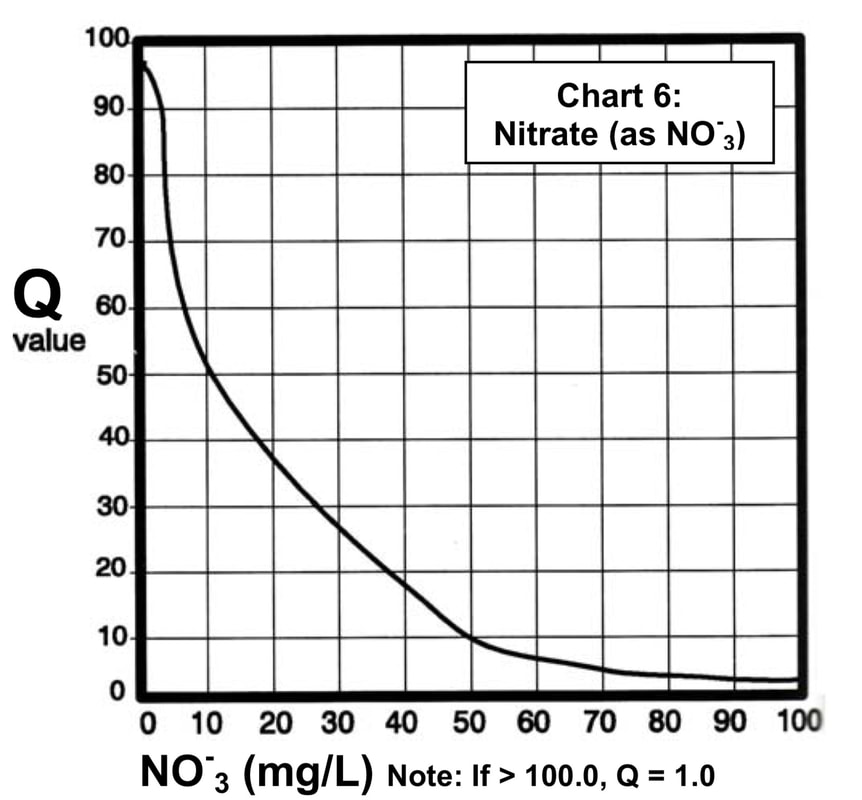
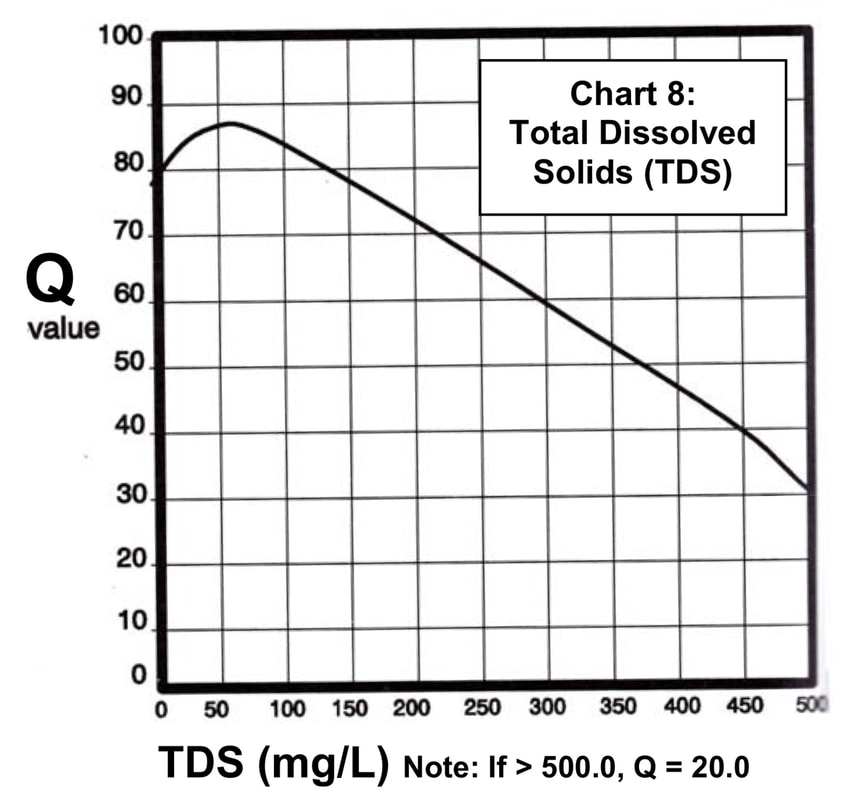
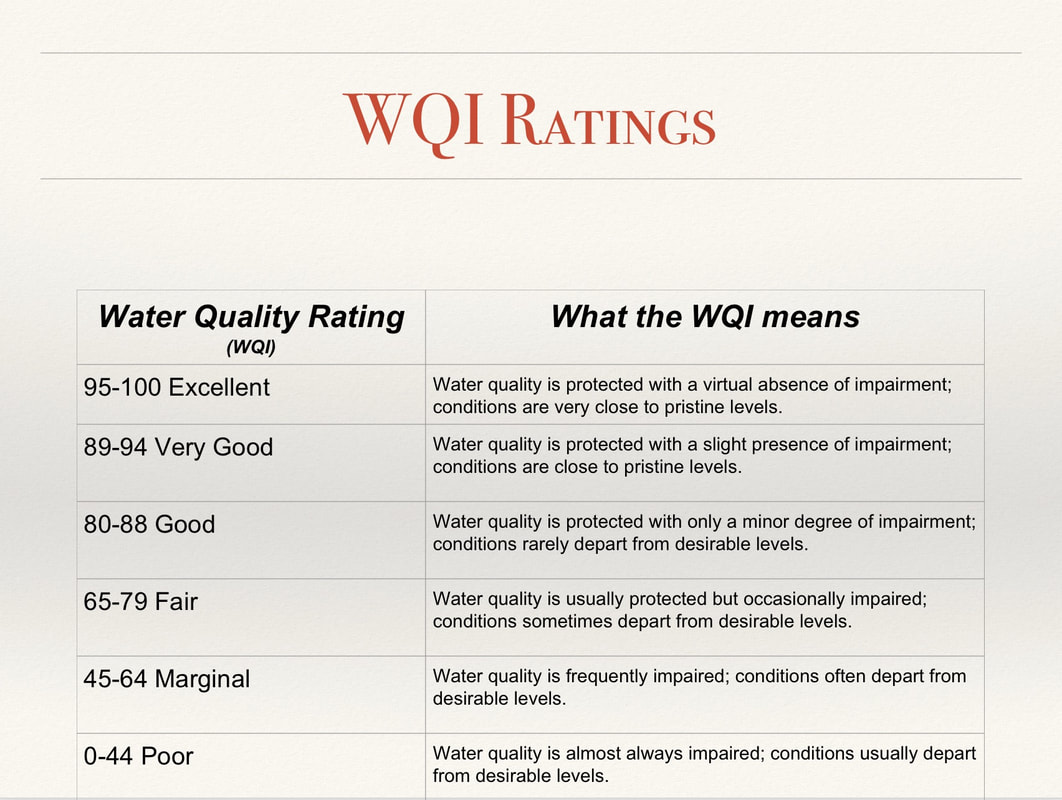
Record the data in the Test Units column and using the Q-Value charts convert the Test Units into Q-Value and record in the Q-Value columns. Once the Test and Q-values columns are complete multiple the Q-values and Weight factors together and place the calculation in the total column. Weight factors water index method classified the water quality according to the degree of purity, using the most commonly measured water quality variables, such as temperature, pH, turbidity, faecal coliform, dissolved oxygen, biochemical oxygen demand, total phosphates, nitrates and total solids. Add up all the parameters total in the Total column to calculate the Overall Water Quality Index. The method has been widely used by various researches the water quality data are recorded and transferred to a weighting curve chart, where a numerical value of Q-value. The final step is to compare the Overall Water Quality Index found on the last page of the "Water Quality Index worksheet" entitled, WQI Ratings chart .
Record the data in the Test Units column and using the Q-Value charts convert the Test Units into Q-Value and record in the Q-Value columns. Once the Test and Q-values columns are complete multiple the Q-values and Weight factors together and place the calculation in the total column. Weight factors water index method classified the water quality according to the degree of purity, using the most commonly measured water quality variables, such as temperature, pH, turbidity, faecal coliform, dissolved oxygen, biochemical oxygen demand, total phosphates, nitrates and total solids. Add up all the parameters total in the Total column to calculate the Overall Water Quality Index. The method has been widely used by various researches the water quality data are recorded and transferred to a weighting curve chart, where a numerical value of Q-value. The final step is to compare the Overall Water Quality Index found on the last page of the "Water Quality Index worksheet" entitled, WQI Ratings chart .
Level 8 Videos: Watch the Videos to further understand water quality
|
|
|
Level 8 Elaborate: Set up the lab with 3 different treatments of Vegetation on your slopes and water it for 2-3 days and predict which one will be the most efficient in controlling erosion.
Download the lab below and construct the three treatments and set up your lab in the greenhouse and collect the data daily using the chart that is included in the written lab instructions. You can download the lab by clicking the button blew or get it from those of you are using Google Classroom. Don't forget to submit your data and data analysis below in the google slides file. Turn all your work in using Google Classroom.
Level 8 Review:Prepare yourself for the unit Test
To complete this assignment you will need both of these documents. The one on the right has pertinent background information that will be needed as you collect your data and if you are working with a partner one of you could be working with this document to collect data, mean while your partner could be collecting the samples and setting up the lab with the document on the left. The goal on this activity is for each of you to write your own miniature science paper following the directions in the "Water Quality Testing" lab paper on the left.
