Climate Change
UC Davis scientists work to ID food crops that can survive global warming
|
By Pat Bailey
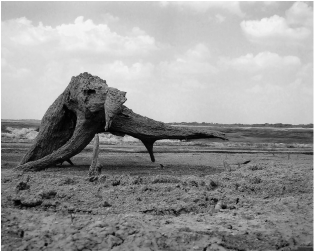
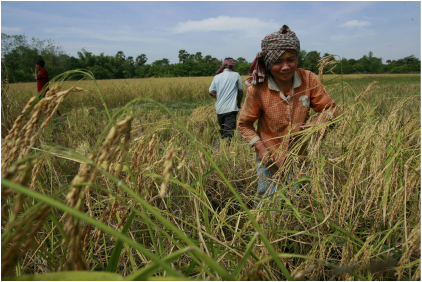
CREATED: 01/10/2015 04:37:38 PM PST Sometimes it pays to have wild and quirky relatives. That's certainly the case for staple crops that help feed the world. It also helps — both the plants and the people who depend on them — to have leading geneticists searching for family traits that could ensure those crops thrive in a warmer, drier world. Researchers at UC Davis and around the world are scrambling to develop new varieties of food and fiber crops that will produce abundant yields despite drought and other effects of climate change. They're also exploring more water-efficient ways to grow existing crops. We're headed toward a future that will have billions of more mouths to feed with much less water, higher temperatures and no room to expand the global farm. •It's not just about developing less-thirsty crops. With reduced rain and irrigation water, you also get higher salt concentrations in the soil, meaning that many crops of the future will need to be salt-tolerant. •And to dodge the warming temperatures, some crops now grown during the summer months will, in certain regions, become winter-season crops — meaning they'll also have to get by on the shorter stretches of daylight that accompany winter. Juggling, heat, light, salt and scarce moisture is a tall order, but scientists are already finding such multifaceted solutions in the genes of both domesticated plants and their ancestors. With some plants, they're searching for genetic "markers" that will identify the genes responsible for various stress-tolerance traits, speeding up conventional breeding. In other cases, they expect to insert genes from the wild relatives into existing crop varieties, better equipping them to adapt to climate change.Some examples are: To make rice around the world more tolerant of drought conditions, plant scientist Eduardo Blumwald and his lab colleagues are investigating rice genes that will delay "leaf senescence" — that normal phase when the older leaves begin to decline and the plant, like an aging factory, begins to shut down. Blumwald and team hope to develop rice varieties that don't rush quickly into senescence during drought conditions, but rather continue the leaf-based photosynthetic process that yields the nutrients necessary to make the rice grains. |
Plant geneticists Jorge Dubcovsky, Jan Dvorak and colleagues are mapping, isolating and cloning genes from the massive wheat genome (16 million base paris), investigating the critical stages of the development cycle, including genes that impact a plant's drought tolerance.For example, genes that allow wheat to flower a few days early — saving precious irrigation water — could be used to develop new climate-flexible wheat varieties. Dubcovsky's laboratory also has recently identified a region of a rye chromosome that, when introduced into wheat, increases yield and improves the water status of the plant under limited irrigation. Dvorak's lab is working to develop salt-tolerant wheat that could be irrigated with poor-quality water, saving the better water for other uses. •The commercially grown modern peanut emerged thousands of years ago from a natural hybrid fusion between two wild peanut ancestors, meaning that scientists find themselves studying something of a double genome. Research scientist Lutz Froenicke in Professor Richard Michelmore's laboratory at the UC Davis Genome Center developed "ultra-high density" genetic maps for the two peanut ancestor genomes. These maps serve as frameworks for sorting the pieces of the legume's genomic puzzle and then putting them back together at the chromosome scale, better equipping the world to make sure that peanuts keep producing as the climate changes. •Maize spans global cultures and eons of time, having been domesticated some 9,000 years ago from wild tiosente grasses in Mexico and elsewhere in Central America.Plant geneticist Jeffrey Ross-Ibarra is studying the genetic diversity and domestication of maize, as well as maize breeding. He's particularly interested in how maize adapted from its origin in the lowlands of Mexico to growing in the high altitudes of Central and South America. Genes for those adaptive traits might also prove invaluable in developing corn or maize varieties that can adjust to climate change. |
Introduction: Reading Circle: UC Davis scientists
In your table groups read the above article and complete the Discussion Sheet below
Level 6 Guiding Question: What is climate change and how will it impact California and the World?
Answer the following questions on the assignment form.
- Explain the mechanism of the greenhouse effect.
- Compare the effects of the greenhouse effect on Mars and Venus to that on Earth.
- Define and quantify global warming.
- Describe paleoclimatic changes over the course of Earth’s history. How are these data collected, when no one was around to measure temperatures?
- Summarize the evidence for greenhouse gases as the cause of recent global warming.
Level 6 Investigation: Greenhouse Effect Simulator
Click on the button below to learn what in the "Greenhouse Effect", how it works and what we can do to control it. This activity requires Adobe Flash so you will have to use a laptop or desktop computer to view it!
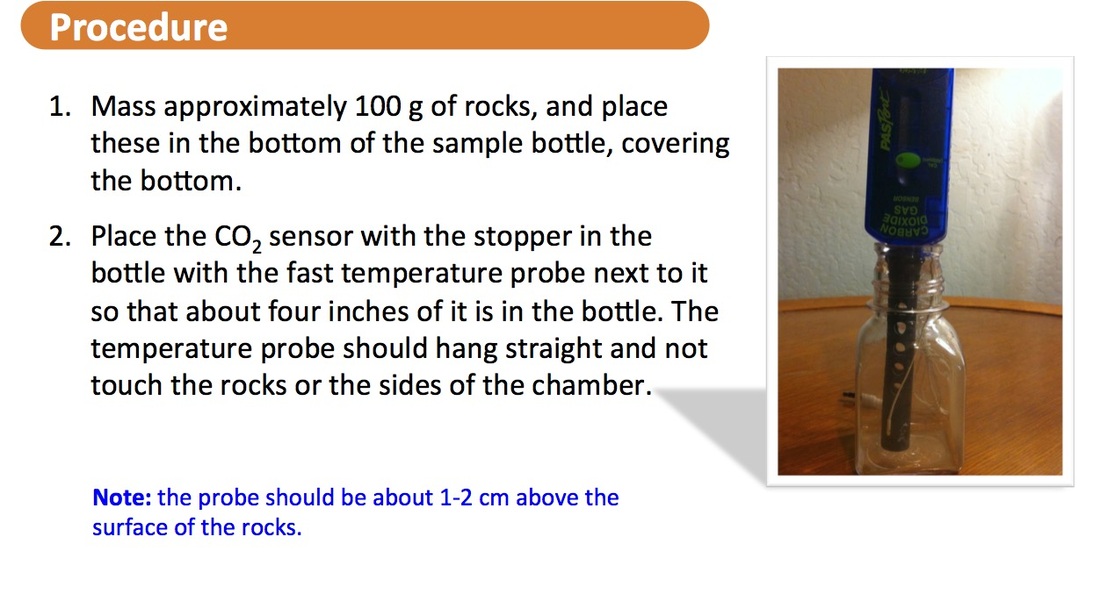
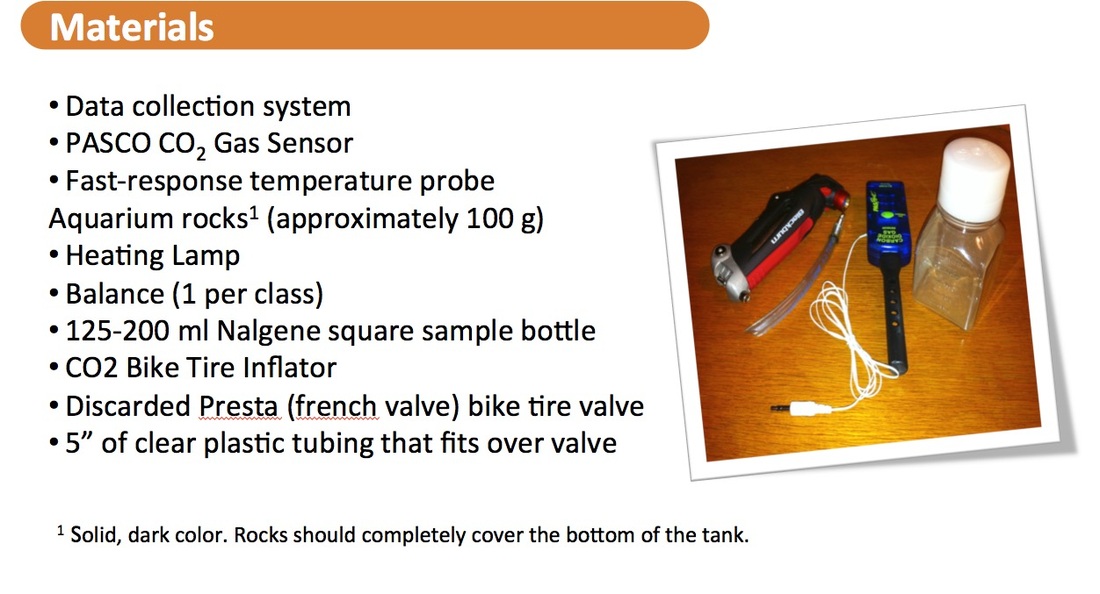
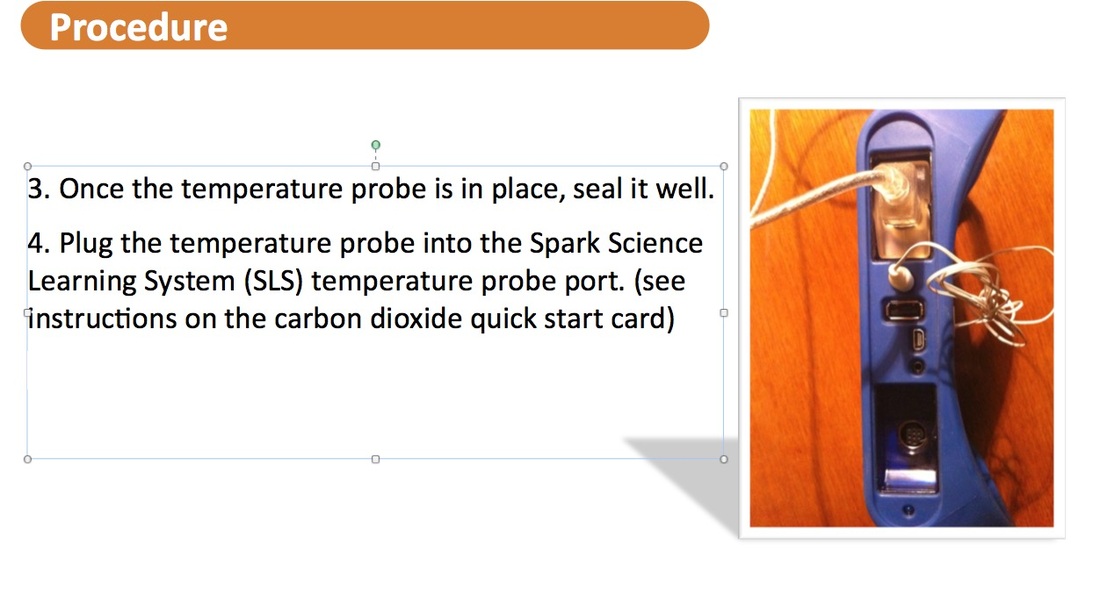
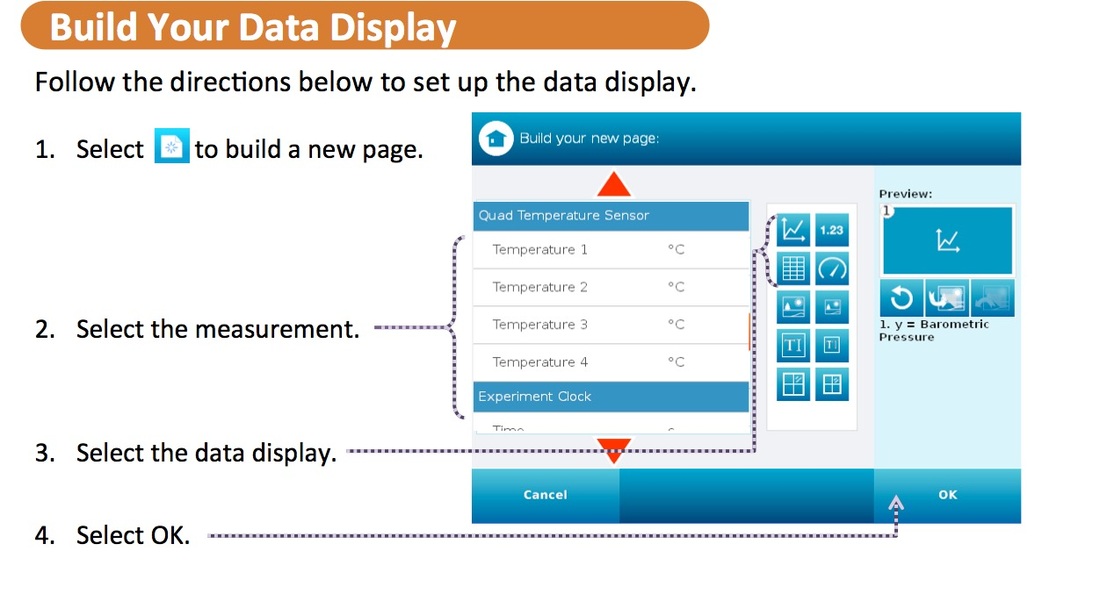
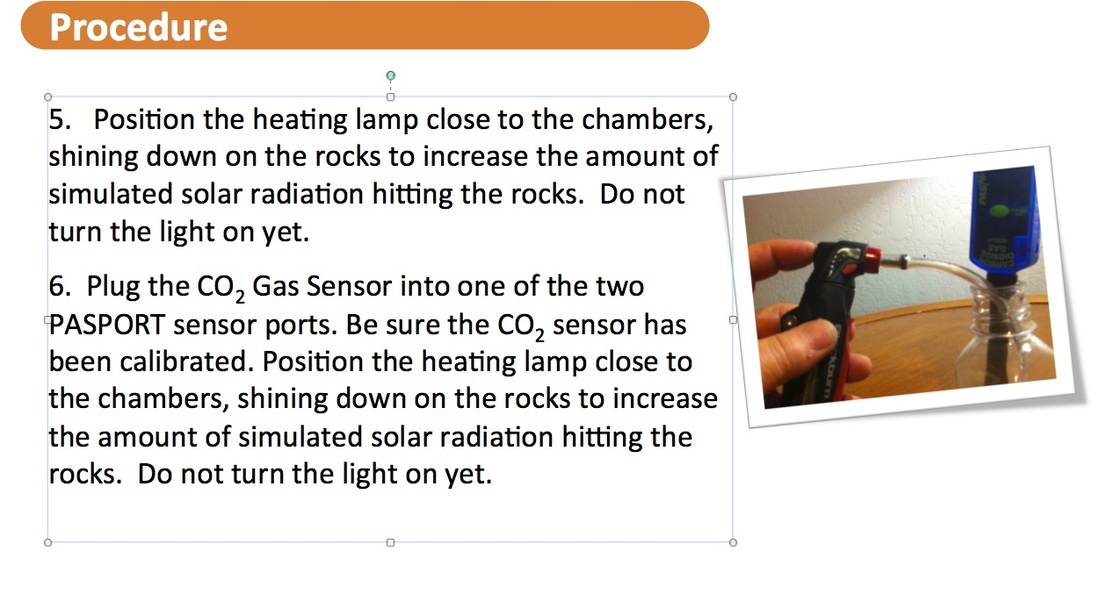
Level 6 Investigation:Carbon Dioxide's insulating power
|
|
|
|
|
|
Climate Change & Carbon Dioxide Lab Video |
Making a Graph for your Science Fair |
|
How to setup, calibrate and collect data for the climate change and carbon dioxide lab.
|
How to use google sheets to make graphs
|
|
|
|
Data Entry
Level 6 Videos
|
|
|
The Greenhouse Effect & Climate Change
Level 6 Elaborate
Make an Infographic on Climate Change
|
To understand what an infographic is please read the website on the left. It will inform you on their purpose and how to build them and what they should display. A ton of examples are displayed and explained. Any topic on climate change maybe used to build your infographic remember, KEEP IT SIMPLE! After you know what an infographic is, spend some time getting familiar with the types of infographics and their design tips.
|
Click on the button to learn how to use Easel.ly You will be using the website called "Easel.ly" so get familiar with it.
Student Sample of an Inforgraphic for Greenhouse Gases

Make a Educreation an inforgraphic on Ozone or Greenhouse Gases
|
To complete this section you will need to complete an infographic on Ozone or Greenhouse Gases. In your project you work myself to create an informational yet creative inforgraphic (see the article above to read how to make them). First watch the above vidoes on Ozone or Climate Change you may also read the chapter on Climate Change before you design your infographic. In additon, a short on how to use www.easel.ly is included. This will be due by Friday.
|
|
Level 6 Review: Practice Quiz
Level 6: Summary
|
Watch the video entitled "Plant the Seed!" The Once-ler challenges Ted to plant the last Truffula seed and says, "....it is not what it is, it is what it will be come!"
|
Assignments for this Unit: Due by Friday 1-30
Introduction, Reading Circle: UC Davis scientists
BLOG Alert: Inconvenient Truth Video Clip
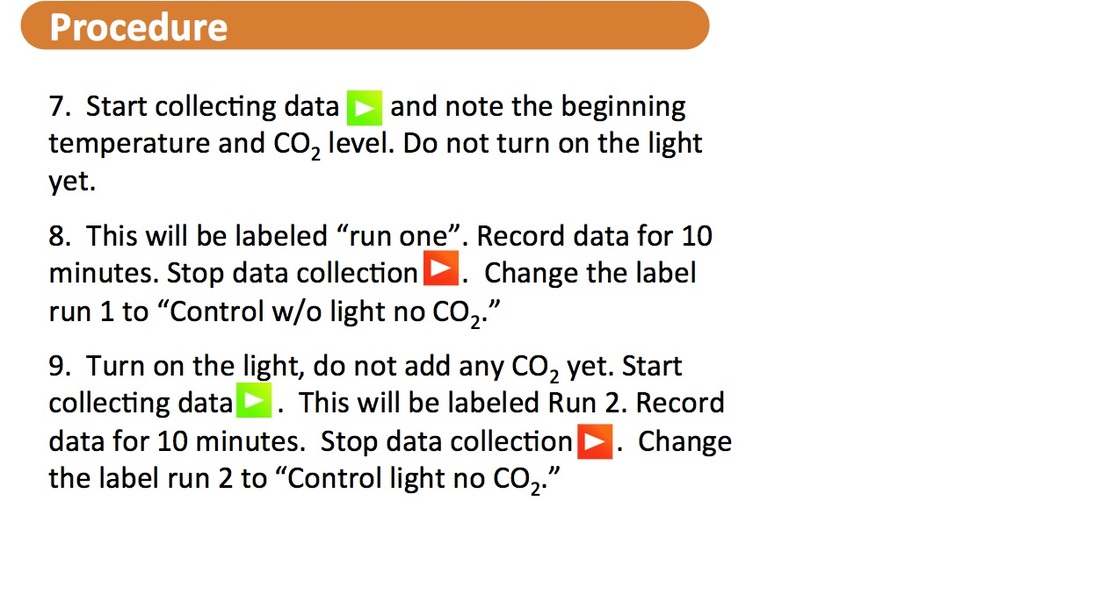
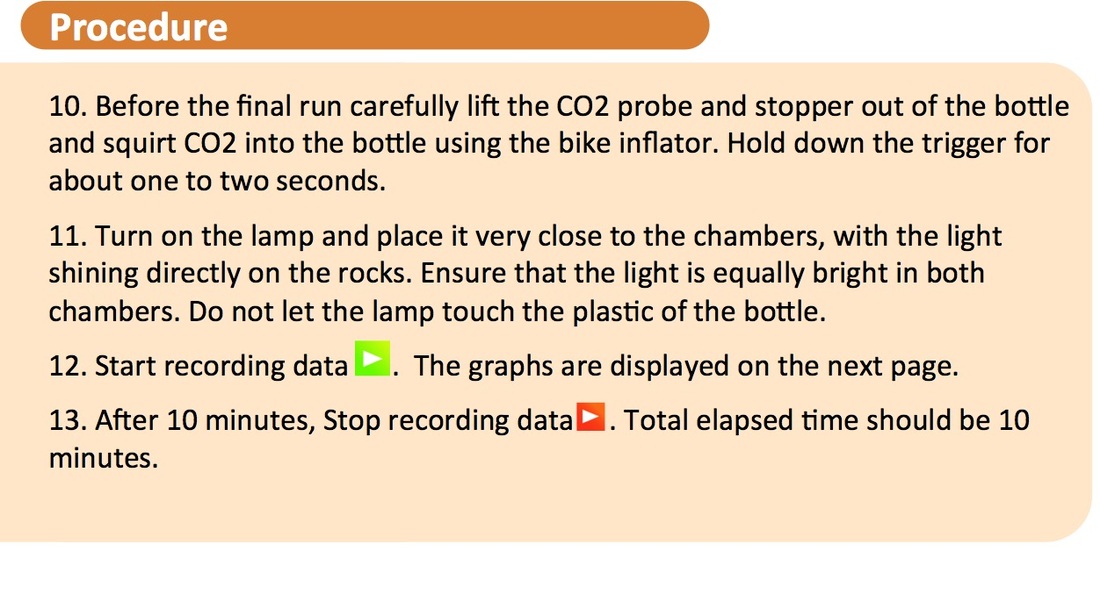
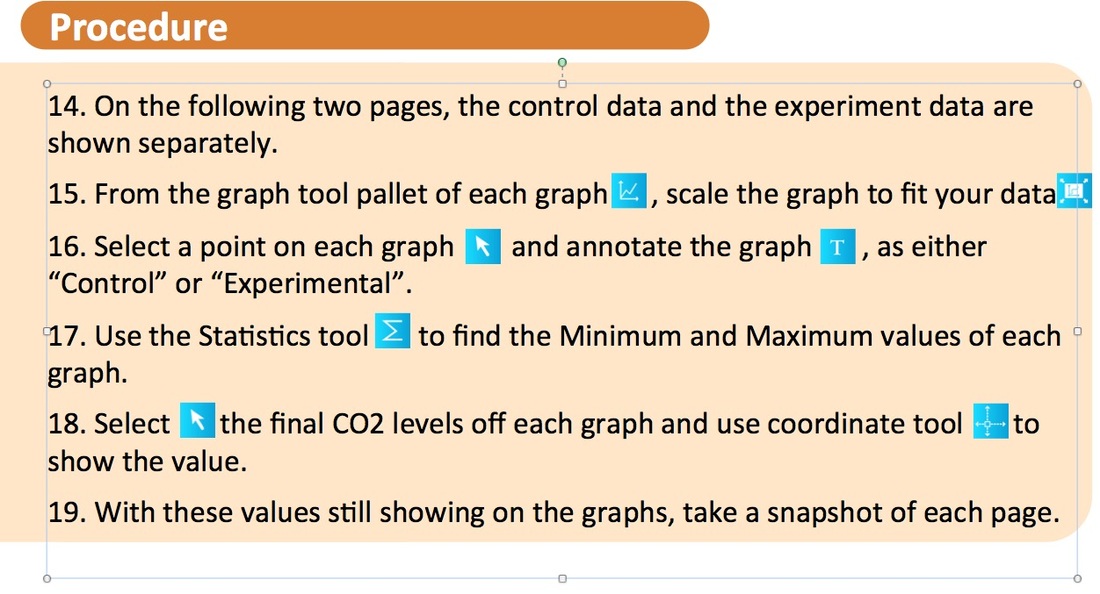
Level 6 Investigation:Carbon Dioxide's insulating power Lab
Level 6 Investigation:Data Entry
The Greenhouse Effect & Climate Change (form)
Level 6 Elaborate: Make an inforgraghic on Greenhouse Gas
Level 6 Summary: Blog on the Onceler
BLOG Alert: Inconvenient Truth Video Clip
Level 6 Investigation:Carbon Dioxide's insulating power Lab
Level 6 Investigation:Data Entry
The Greenhouse Effect & Climate Change (form)
Level 6 Elaborate: Make an inforgraghic on Greenhouse Gas
Level 6 Summary: Blog on the Onceler
